Featured
Read about all our new developments and features......
New Overlays Available
We’ve added new overlays to the service.
The teaching community is at the heart of what we do, and after hearing from your valuable feedback, we are excited to announce that we have added several new overlays to Digimap for Schools, available on the service from Thursday 14th October 2021.
We think these have lots of potential for exploring human and physical geography as well as global climate. Check out this post to find out more.
We have reorganised our Overlays menu into different categories:
- GB Overlays: British National Grids, Colouring In and Postcodes
- World Climate (NEW): These new categories include average maximum and minimum temperatures and average precipitation
- World Human Geography: World Place Names, Population Density and World Timezones
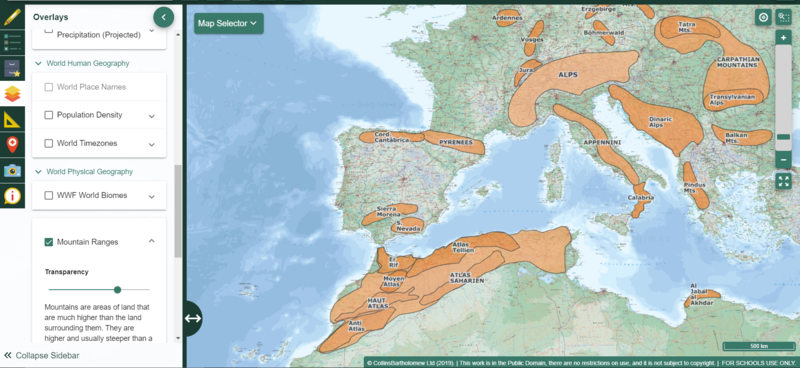
- World Physical Geography: WWF World Biomes, Mountain Ranges, Volcanoes and Tectonic Plates and its Plate Boundaries.
- Reference Grids: Latitude/Longitude Grid, Major lines of Latitude
Viewing more than one overlay at a time & Get Feature Information
You can view more than one overlay at a time to support your teaching of locational knowledge and other topics as required in the Geography Curricula. For instance, you could view Population Density along with Biomes, to illustrate lower population density in areas of tundra. Or you could try population density with mountain ranges to show how physical geography can influence settlement and migration.
Check out our video guide here
Lastly, the Get Feature Information can be used on two of the overlays, World Biomes and Volcanoes. To see the information pop-up, just select the Get Feature Info. button (see image below), and then select the location on the map you are interested in.
![]()
For more information about the overlays and their data sources, please click here to access the overlays’ guides.
Population Density
This overlay shows the World Global Population Density (i.e., persons per sq. km).
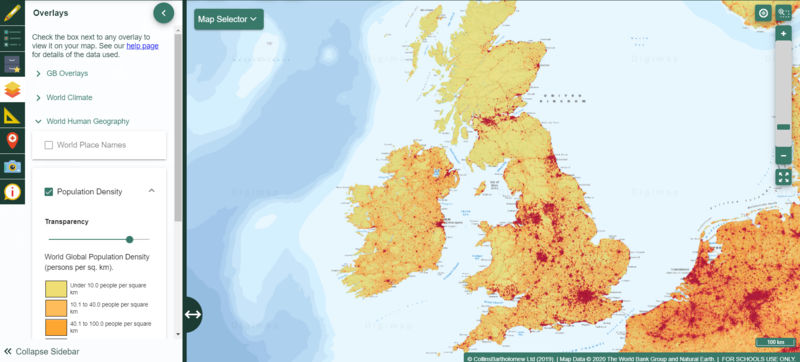
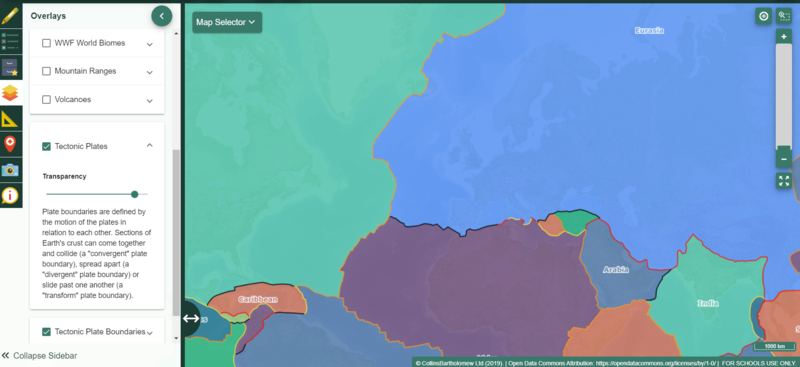
Tectonic Plates & Tectonic Plate Boundaries
These overlays explore the different types of tectonic plates around the world, and their plate boundaries.
You can view the tectonic plates (with names), plate boundaries, or both.
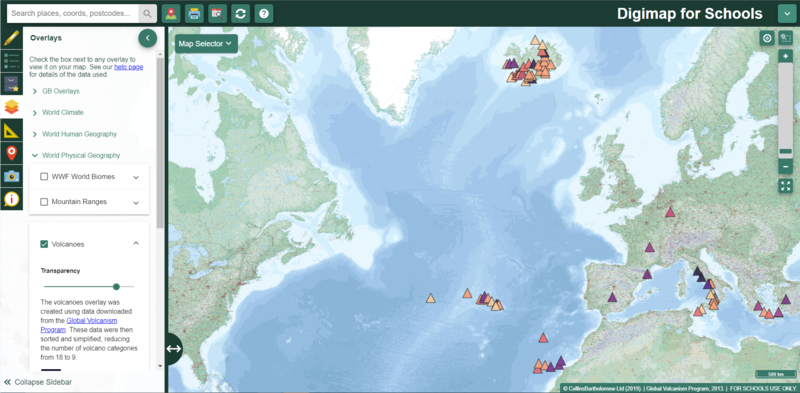
Volcanoes
The volcanoes overlay was created using data downloaded from the Global Volcanism Program. These data were then sorted and simplified, reducing the number of volcano categories from 18 to 9.
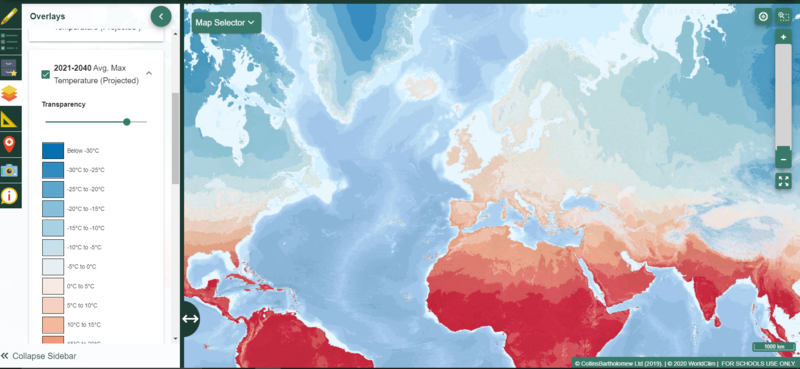
Average Temperatures and Precipitation
In these overlays, you can explore the information available on historical and projected average global temperatures, and precipitation, such as:
- Average Temperature (1970-2000 & 2010-2018)
- Avg. Min. Temperature (Projected) 2021-2040
- Avg. Max. Temperature (Projected) 2021-2040
- Avg. Precipitation 1970-2000, 2010-2018, and 2021-2029 (Projected)
Mountain Ranges
The Mountain Ranges overlay explores the groups of mountains (i.e., areas of land higher than 600m) located around the world. NOTE: some labels may not be visible at every scale - you may need to zoom in/out to see labels for some ranges.
Explore our resources
Have a look at our free to use resources - games, challenges and fun activities to support creative, engaging and interactive learning - to see what you can create and learn.
Explore our resource hubJoin our community
Subscribe to the Digimap for Schools newsletter for all the latest updates on new features functionality and resources.
Subscribe

