

User manual
Add your own data
Table of Contents
Your data
It’s possible to add your own data to Digimap for Schools to create points, lines and/or polygons on your map. This feature is a great way to start teaching pupils simple GIS concepts and the power of creating their own datasets.
You can import a simple spreadsheet with postcodes and labels. Or if you have been out on fieldwork, you can upload and display data collected within mobile apps. You may have collected certain tree species, locations of graffiti or the postcodes of people you have surveyed in a tourist hot spot.
If you’re creating a postcode list, latitude/longitude coordinates, or national grid references, it’s important to save the file in .CSV (Comma-Separated Values) format for successful import into Digimap for Schools. Each row should represent a single data point (e.g. a postcode or coordinates), while each column contains details like location or labels. The .CSV format structures your data in a way the system can easily interpret, ensuring compatibility and preventing upload errors.
File formats
You can import data in the following formats:
- CSV file - easy to create in any spreadsheet package
- GPX - created by GPS devices.
- Shapefile - a commonly used geographic data file format. For example, you can export survey results from ESRI’s Survey123 app as Shapefile format.
- GeoJSON - a commonly used geographic data file format.
Import your file
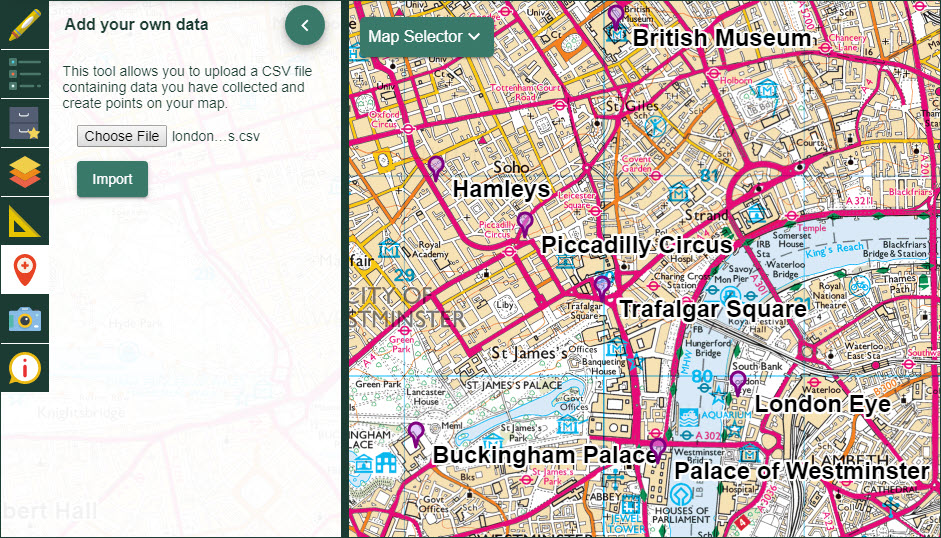
- Select Add your own data in the sidebar.
- Select Choose File.
- Navigate to your file. NOTE: Shapefiles must be in a zip file.
- Select the file.
- Select Open.
- Select Import.
- Your points/lines/polygons should be visible on the map window. See example image below.
Create CSV file
To create a .CSV file, open a spreadsheet program (like Excel or Google Sheets or other spreadsheet packages), enter your data with each row representing an entry and each column representing the details of that entry, then save the file by choosing the “CSV (Comma-Separated Values)” format as your File Type. Note that files of type .xlsx or .txt or .ods will not work.
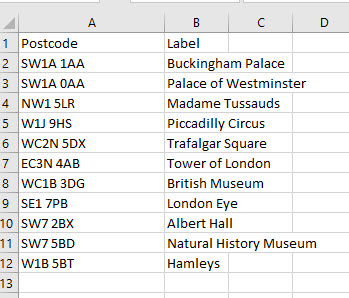
For postcodes:
*  One required column containing postcodes, named *Postcode* in the header row.
*  One optional column containing a label, named *Label* in the header row.
*  We recommend limiting the number of characters in your labels to around 20 characters for a clearer display.
*  Only postcodes located in Great Britain will be recognised.
For Easting/Northing:
*  One required column containing Eastings, named *Easting* in the header row.
*  One required column containing Northings, named *Northing* in the header row.
*  One optional column containing a label, named *Label* in the header row.
*  We recommend limiting the number of characters in your labels to around 20 characters for a clearer display.
For British Grid References
*  One required column containing grid references, named *gridref* in the header row.
* One optional column containing a label, named *Label* in the header row.
*  We recommend limiting the number of characters in your labels to around 20 characters for a clearer display.
For Latitude/Longitude:
*  One required column containing Latitude in decimal format, named *Latitude* in the header row.
*  One required column containing Longitude in decmial format, named *Longitude* in the header row.
*  One optional column containing a label, named *Label* in the header row.
*  We recommend limiting the number of characters in your labels to around 20 characters for a clearer display.
Editing your data
Your data and labels can be edited with the Drawing Tools.
Selecting drawings
Use the Select tools to select drawings in Digimap for Schools.
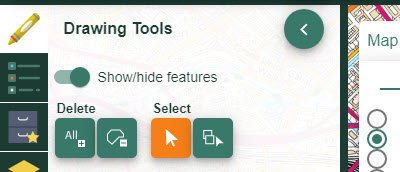
- Open the Drawing Tools from the sidebar.
- Two options for selecting:
- Select arrow to select individual features
- Select by box to select multiple features
- For example, to select a marker:
- First select the Select arrow until the box turns orange.
- Then select the required marker on the map window (it will turn yellow).
Change markers
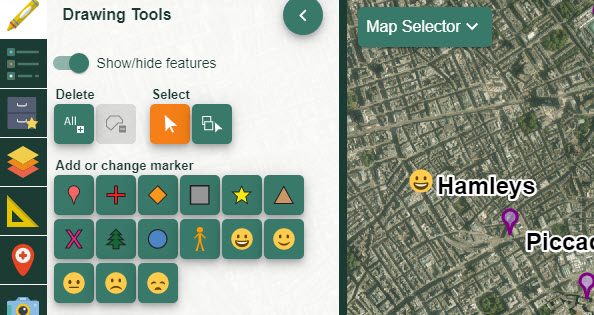
- Open the Drawing Tools from the sidebar.
- Select the marker or markers you want to move.
- Your marker should be yellow once selected. NOTE: if your points have labels, a label box will pop up. Close this by selecting the x in the top right.
- Now select your symbol of choice from the Add or change marker area of the Drawing Tools.
- Click or tap anywhere in the map window to deselect the marker.
Move shape
- Open the Drawing Tools from the sidebar.
- Select the shape or shapes you want to move.
- Your shape should be yellow once selected. NOTE: if your points have labels, a label box will pop up. Close this by selecting the x in the top right.
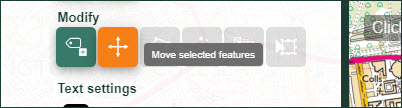
- Now select the move tool - find it in the Modify area of the Drawing tools.
- Click and drag the marker to the required location.
- Click or tap anywhere in the map window to deselect the marker.
Edit label text
- Open the Drawing Tools from the sidebar.
- Select the shape for the label you want to edit.
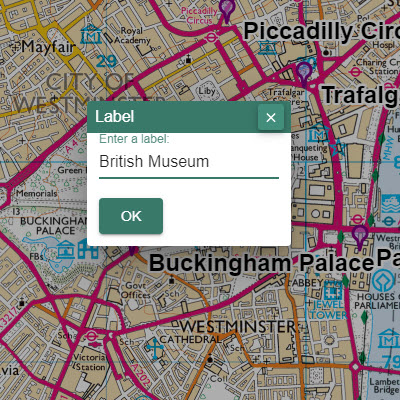
- A box pops up with the existing label text.
- Edit the text.
- Select OK.
- Click or tap anywhere in the map window to deselect the marker.
Edit label font
- Open the Drawing Tools from the sidebar.
- Select the shape for the label you want to edit.
- When you select a label, a box pops up with the existing label text.
- Now go to the Drawing Tools in the sidebar.
- The label box will disappear - don’t worry!
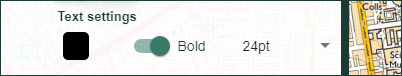
- In Text Settings you can select a colour, bold/regular and a size. Your selections will update your label in the map window.
- Click or tap anywhere in the map window to deselect the marker.
Edit colour of shape
- Open the Drawing Tools from the sidebar.
- Select the shape you want to move.
- Your shape should be yellow once selected.
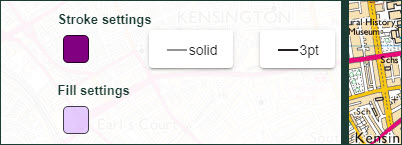
- Now go to the Stroke settings of the Drawing Tools. You can select line colour, type (solid, dot or dashed) and line weight.
- Use the Fill settings to select the fill colour for your marker.
- Click or tap anywhere in the map window to deselect the marker.
Watch the video
Our short video demonstrates adding a file of postcodes.